Diagnosing SLO violations with Path-wise In-band Network Telemetry
In this blog post, I present IntSight, a system for fine-grained detection and diagnosis of SLO violations in programmable networks.
The Context
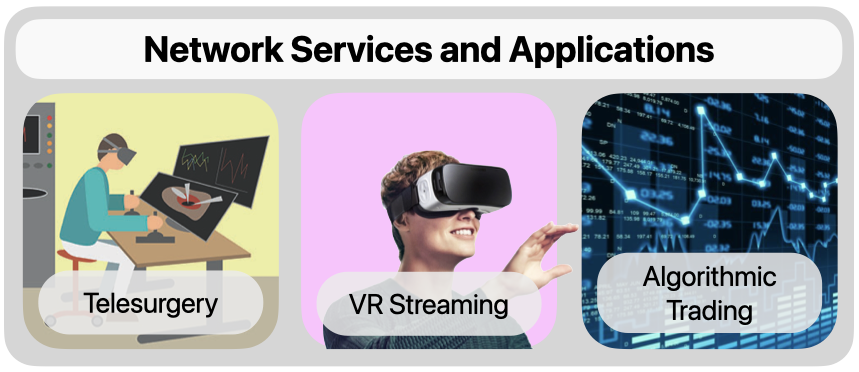
Communication networks operate with high performance expectations on latency and bandwidth, especially with the emergence and proliferation of new services and applications, such as for example, telesurgery, VR video streaming, and algorithmic trading. In this context, users expect strict guarantees on network performance, requiring the definition of the so-called service-level objectives (SLOs). An SLO might prescribe for example, that the end-to-end delay of telesurgery traffic has to be less than 5 milliseconds for 95% of packets, or that the bandwidth provided to a VR video streaming traffic aggregate has to be higher than 1 Gbps at least 99% of the time (within a minute).
Monitoring SLO compliance, and promptly diagnosing violations, is essential for the operation of today’s networks. However, network monitoring is an inherently hard task, sometimes compared to searching for a needle in a haystack. That is because, monitoring SLO compliance requires both: detecting violations, which involves observing the network traffic with very fine granularity, i.e., up to per-packet analysis in some cases (e.g., latency) and diagnosing these violations, which means pinpointing forwarding devices experiencing contentions, and identifying the flows with active traffic on these devices.
Recent work on datacenter networks (e.g., TPP and SwitchPointer) attempt to strike a balance between bandwidth and processing overheads by combining analysis tasks by end-hosts and in-band network telemetry (INT), i.e., collection of device metadata by production packets. These approaches are capable of both detecting and diagnosing violations in datacenter networks. However, control over end-hosts by network operators is undesirable and even impossible in many cases, limiting their applicability. Furthermore, adapting these techniques to other types of networks is not straightforward due to the limited capabilities of forwarding devices when compared to commodity servers.
What is IntSight?
IntSight is a system that fully utilizes the capabilities of network programmability and advances the concept of in-band network telemetry to enable the fine-grained and highly-accurate detection and diagnosis of SLO violations with small monitoring overheads and without relying on end-hosts to carry out monitoring tasks. IntSight’s design is based on four main ideas, or pillars, if you will:
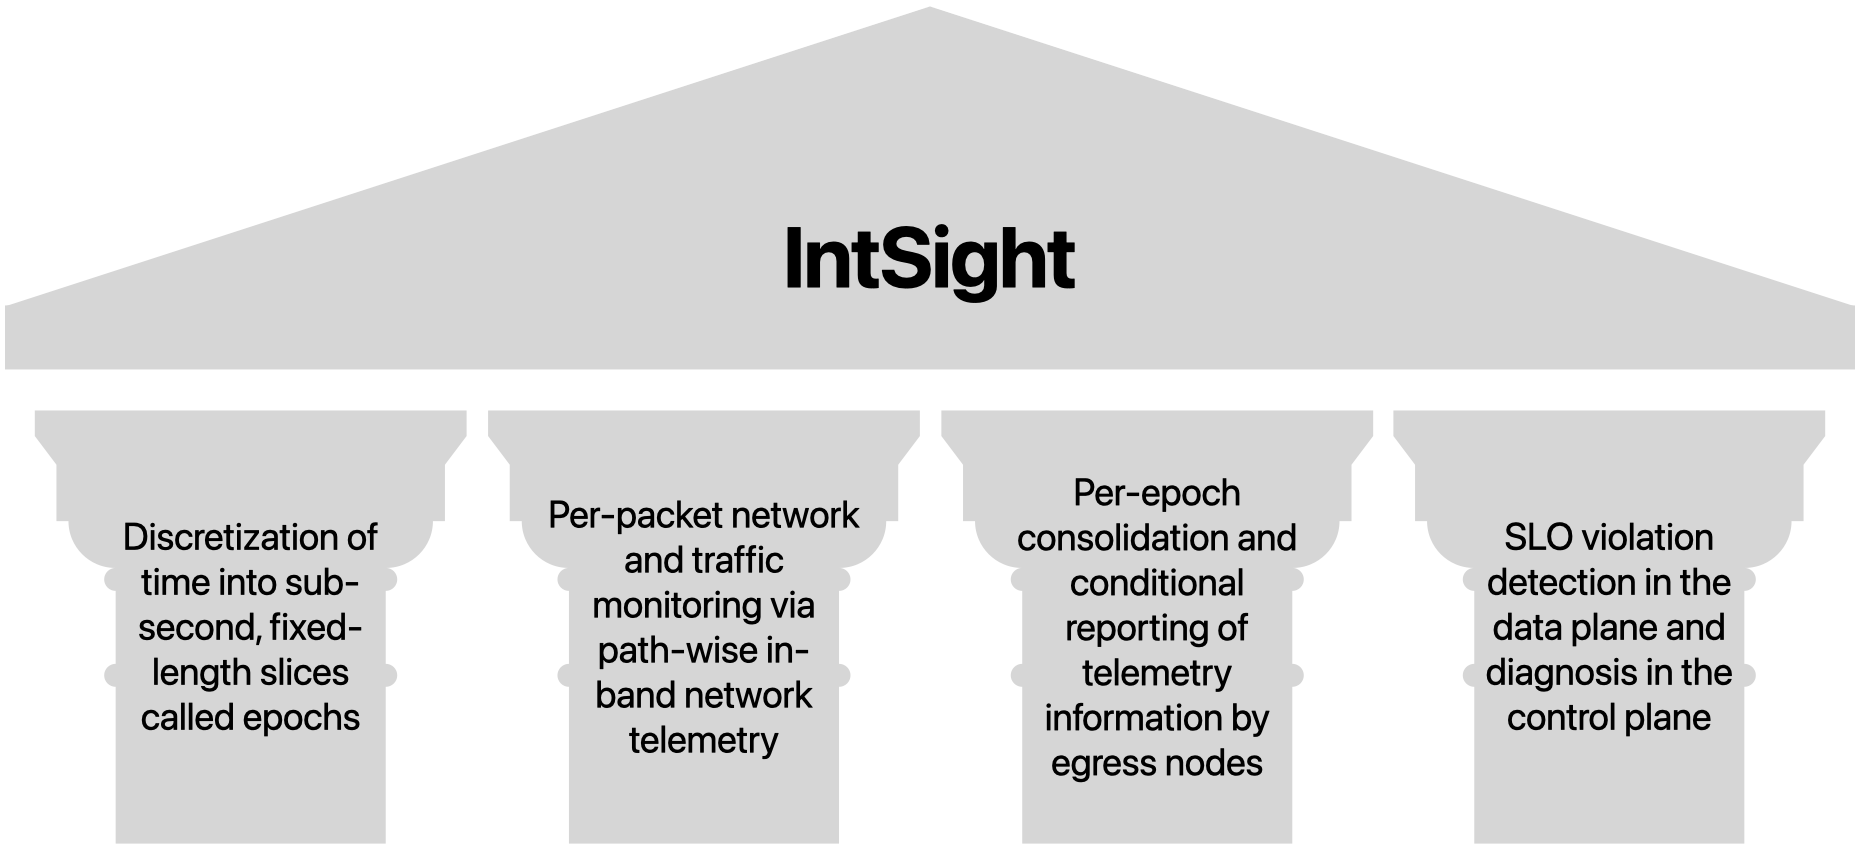
- Discretizing time into sub-second slices called epochs
- Monitoring network and traffic using path-wise in-band network telemetry headers in every packet
- Consolidating telemetry within epochs and conditionally reporting data to collectors
- Detecting SLO violations in the data plane (aka, forwarding devices) and diagnosing in the control plane.
How does it work?
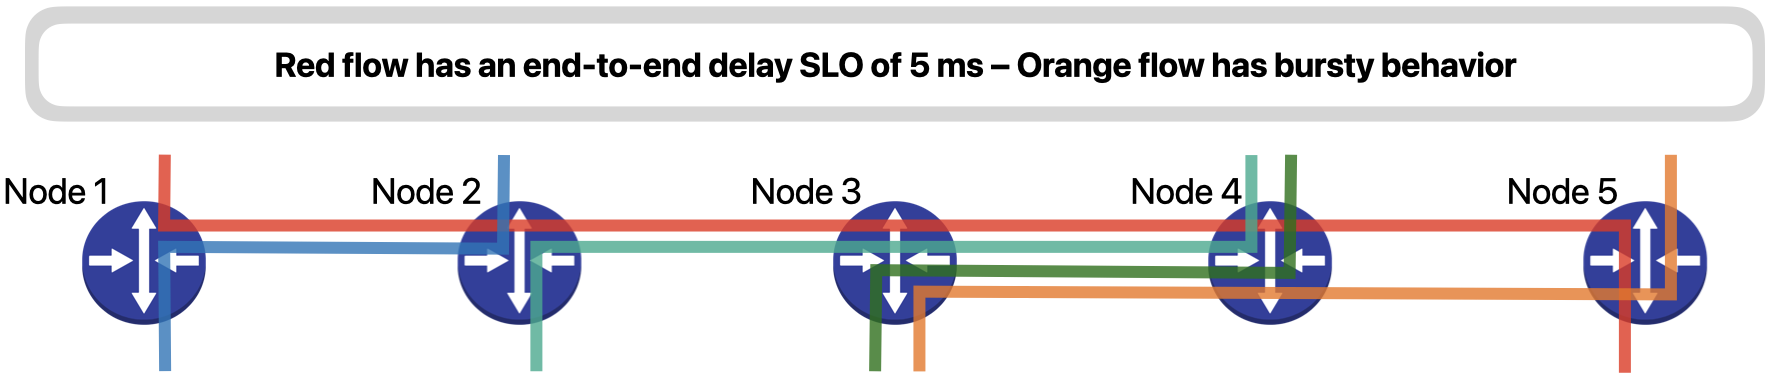
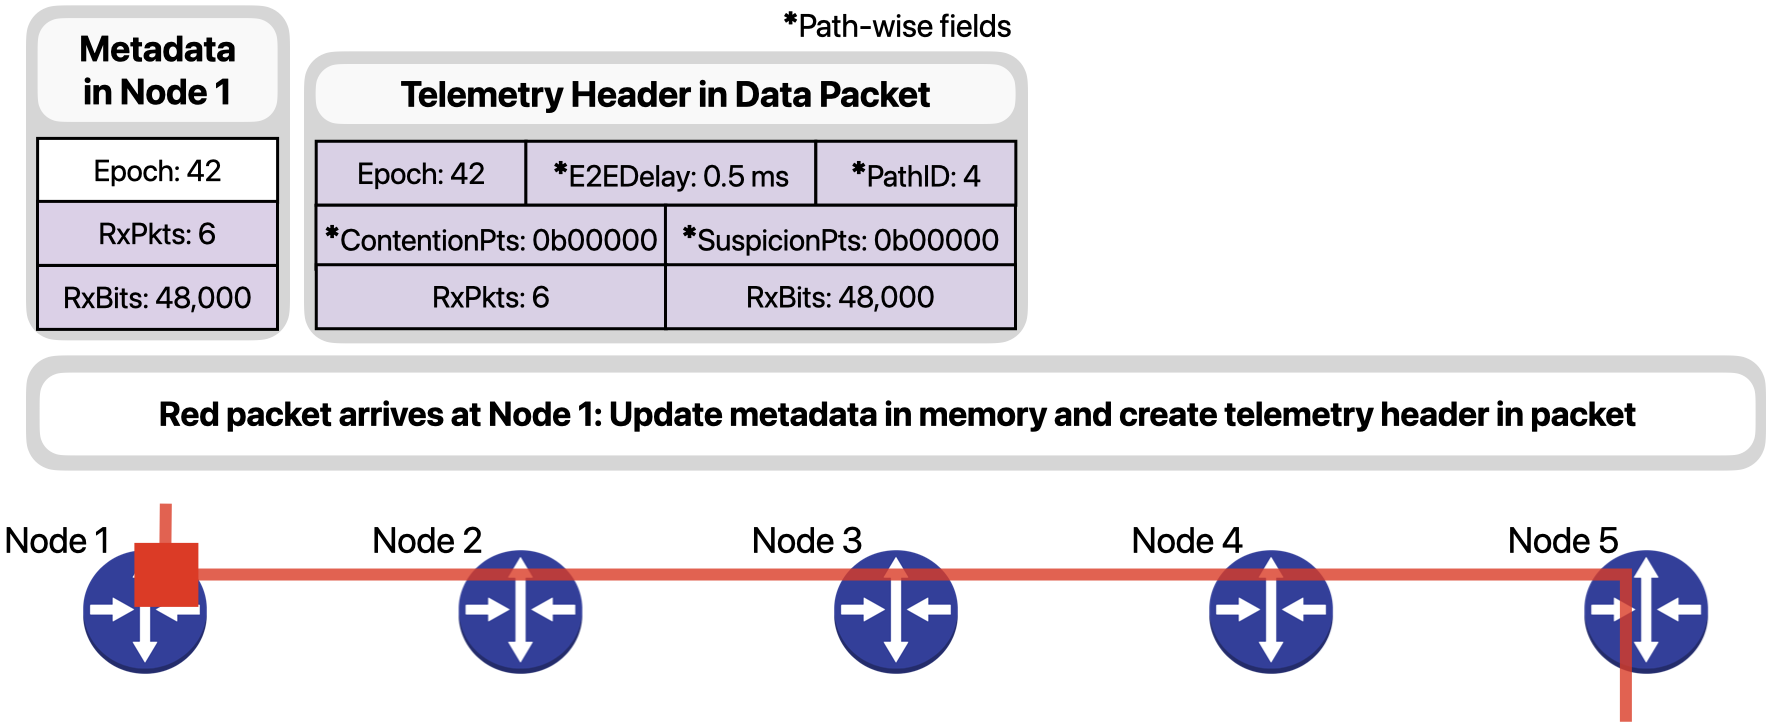
Let’s understand how IntSight works using a simple example. Consider a network with five devices and five traffic flows (Fig. 3). The red flow represents telesurgery traffic and has an end-to-end SLO of 5 milliseconds, while the orange flow has a bursty behavior that occasionally fills up the outgoing queue in Node 3 and severely delays packets of the red flow.
When a red packet arrives at Node 1, as the ingress node for the red flow, it updates the metadata regarding the flow in its memory and creates a telemetry header in the packet.
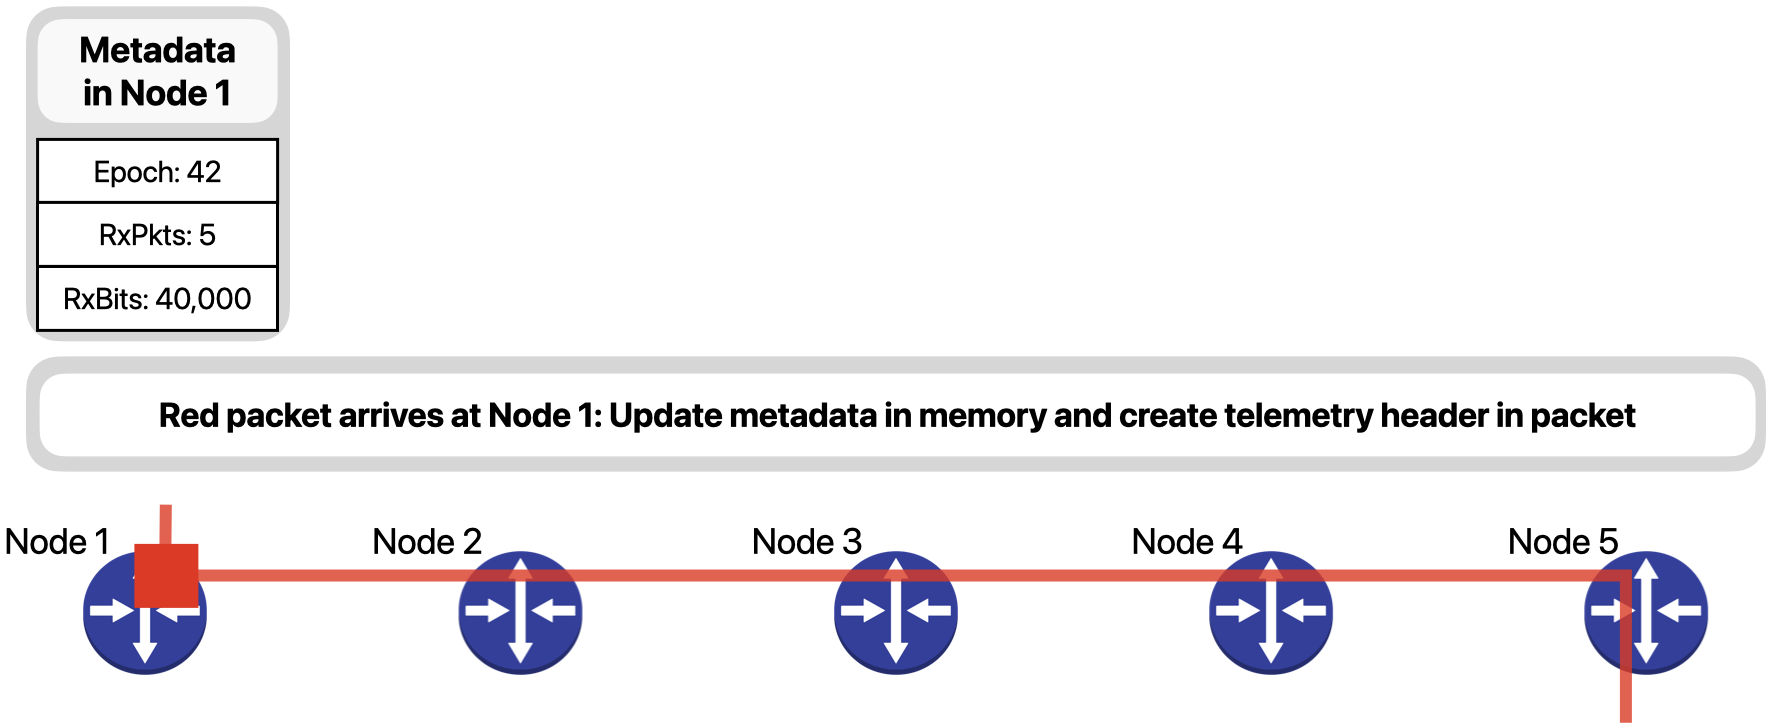
The telemetry header contains the current epoch on the ingress node, the end-to-end delay of the packet until now, the Path ID that identifies the path the packet has taken inside the network so far, the points of contention and suspicion observed by the packet, and the number of packets and bits already received for the red flow during the current epoch. Fields E2EDelay, PathID, ContentionPts and SuspicionPts are all “path-wise” fields, which is to say, they are updated along the path of the packet, as we will see next.
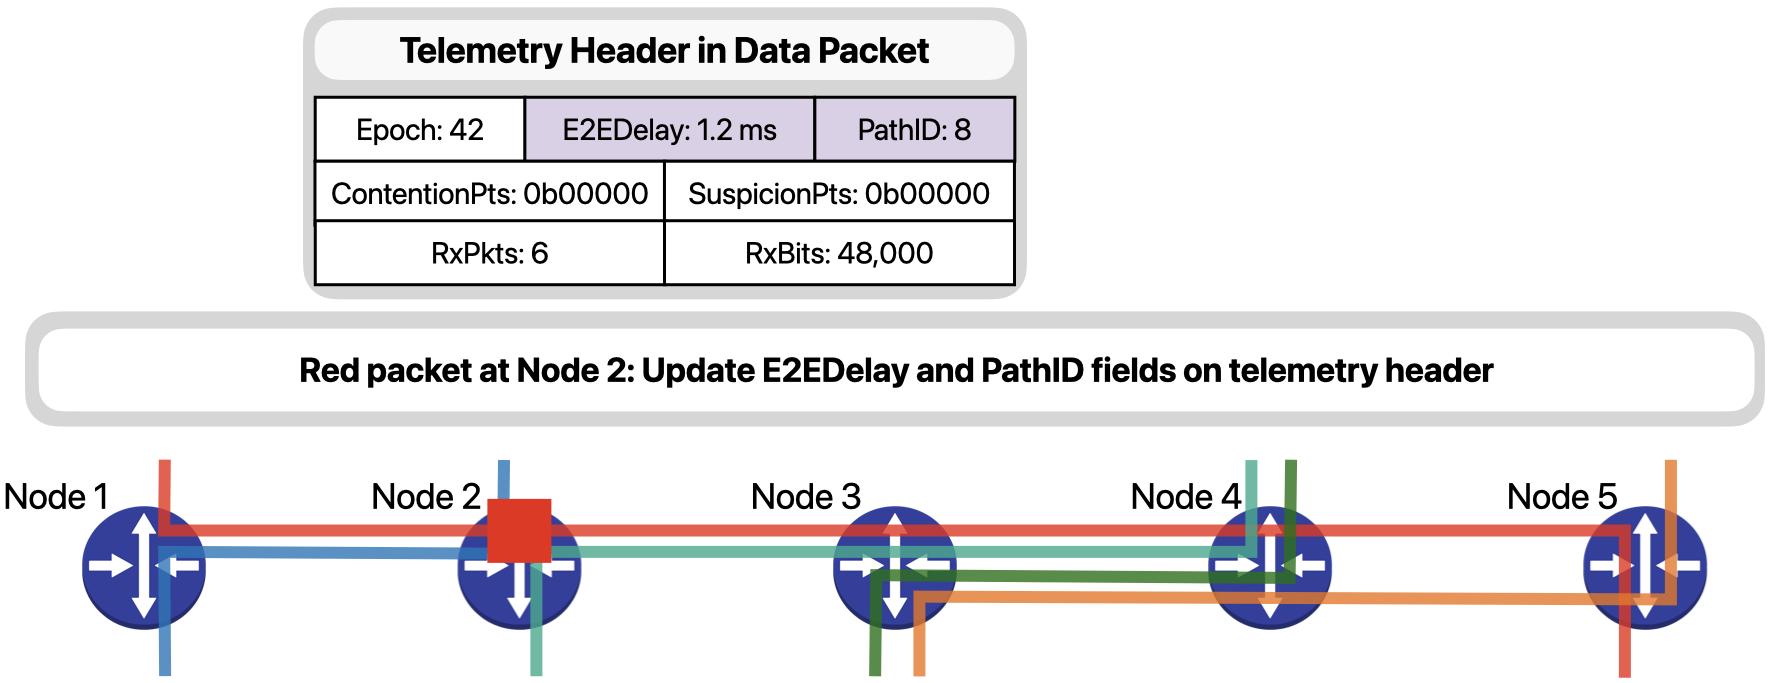
When Node 2 receives the packet, since it is not experiencing any contentions, it simply…
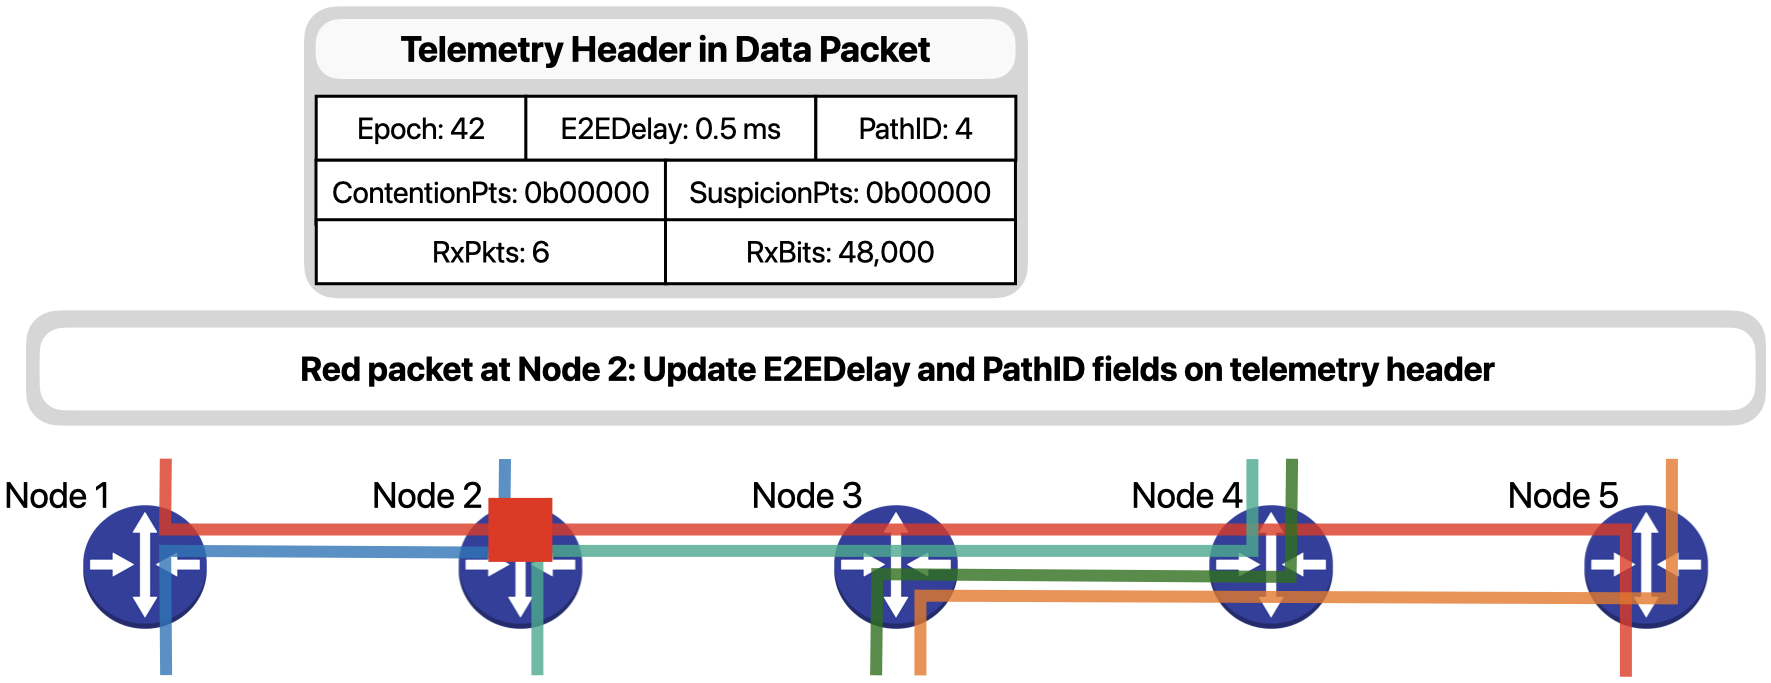
… updates the E2EDelay field with its hop delay and the PathID according to its forwarding decision.
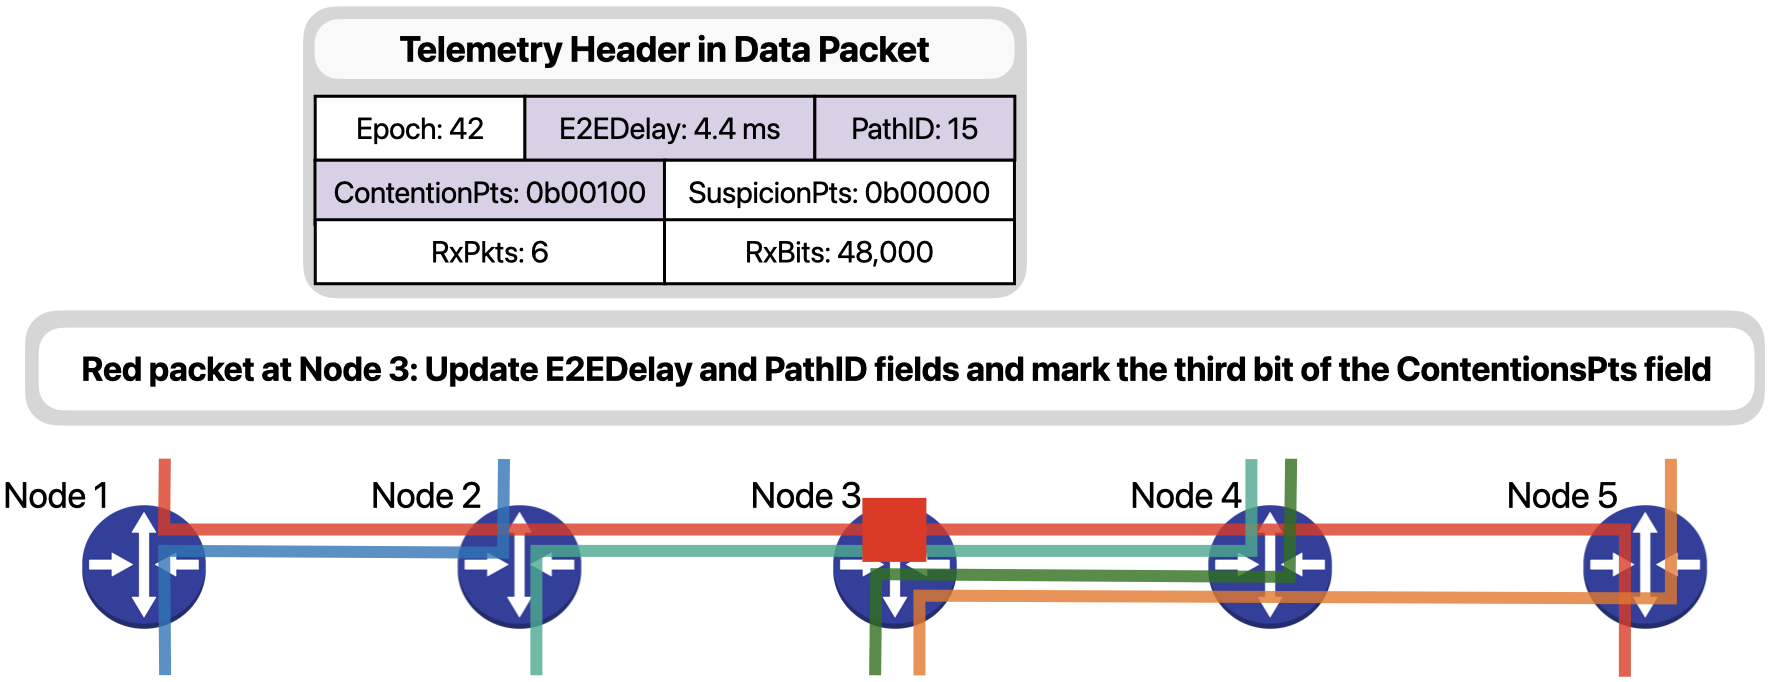
Next, when the packet arrives on Node 3, since it is experiencing contention due to the bursts of the orange traffic…
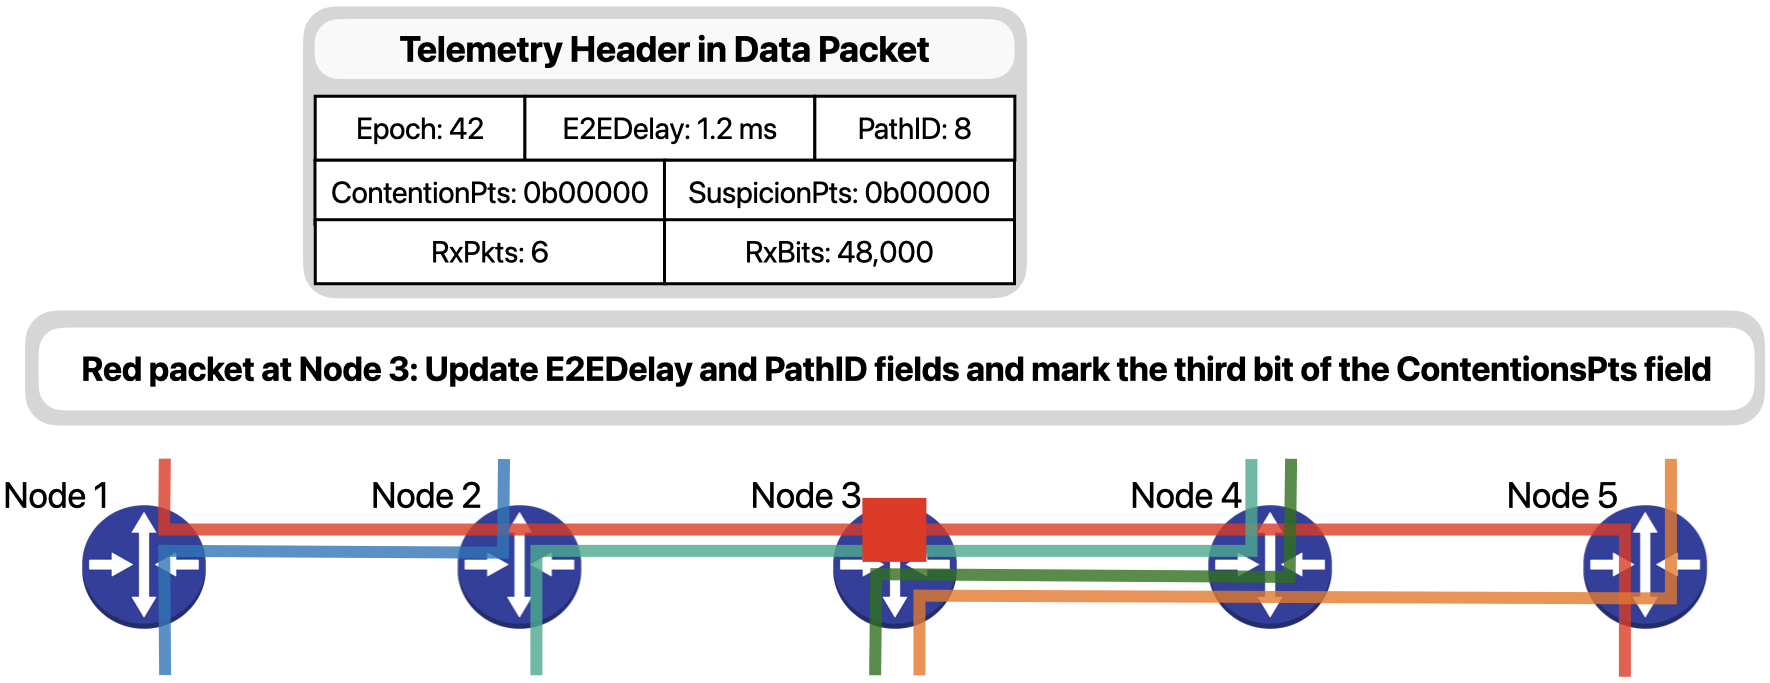
… besides updating fields E2EDelay and PathID, it will also mark the third bit of the ContentionPts field to signal that a contention was observed in the third hop of the packet, that is Node 3.
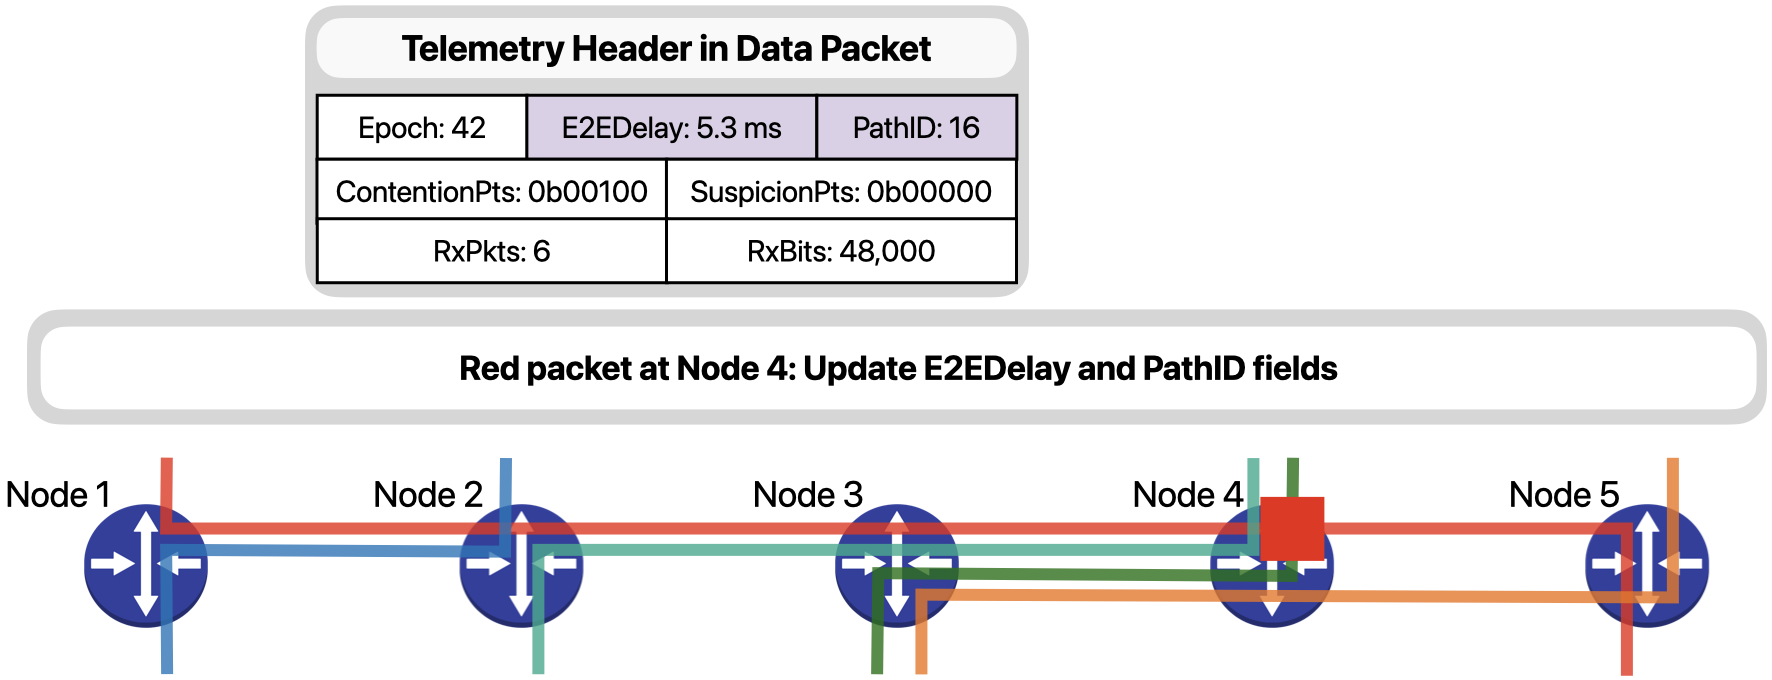
Node 4 simply updates the E2EDelay and PathID fields.
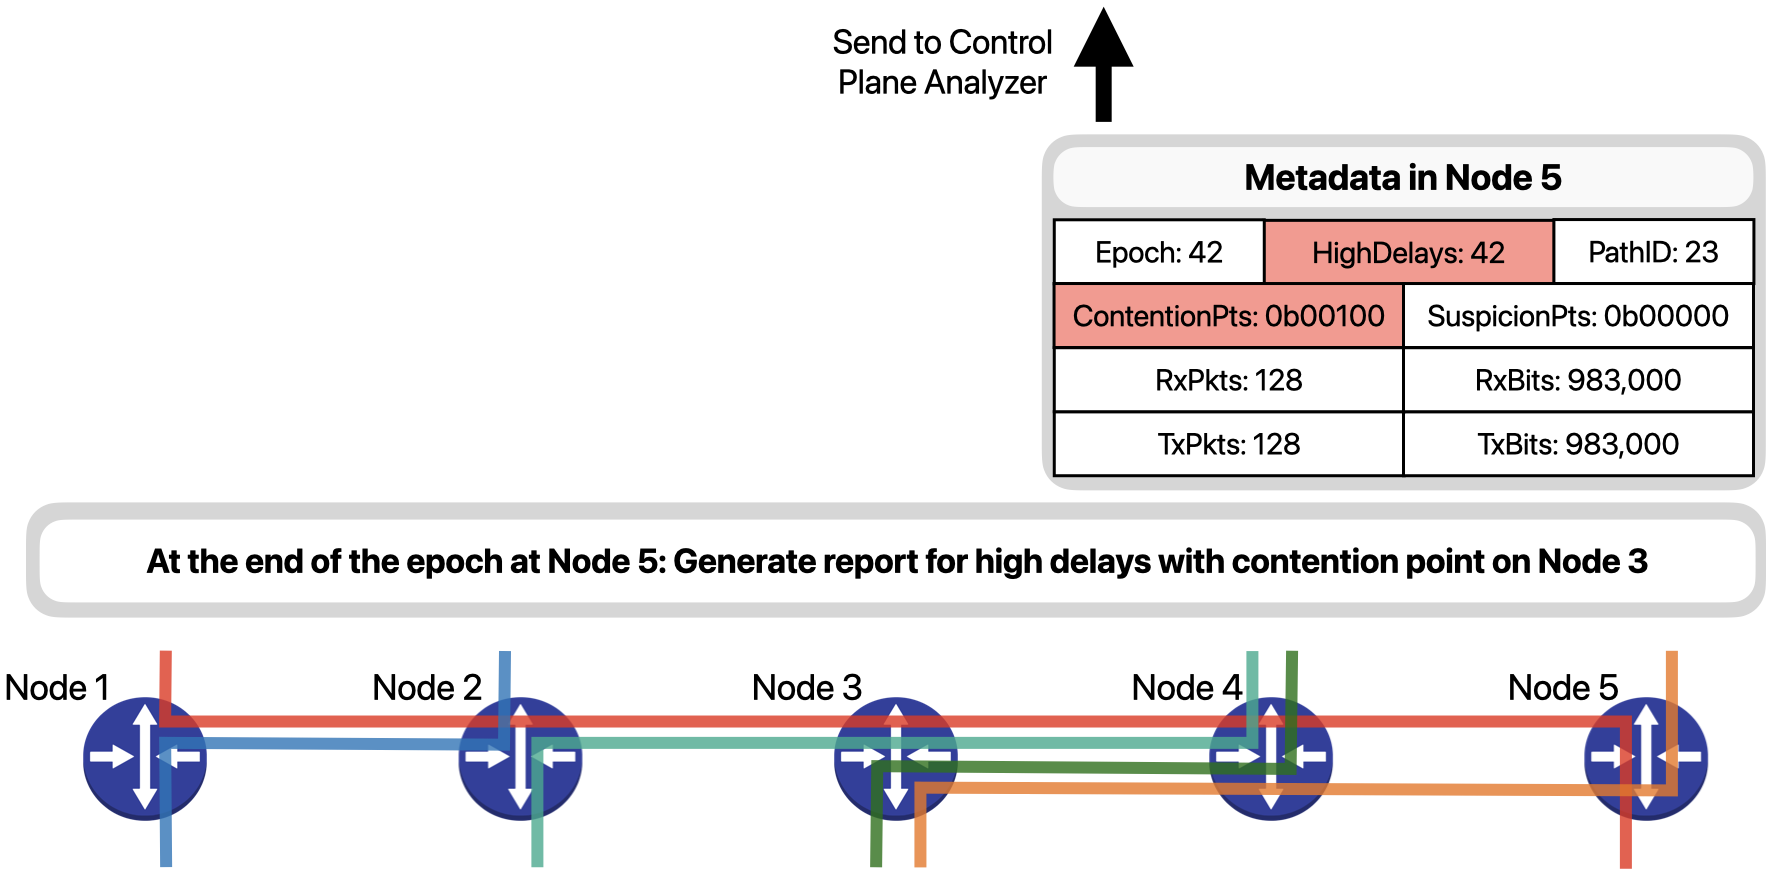
Node 5, as the egress node for the red flow, is responsible for storing additional metadata about the flow. After updating the necessary path-wise fields, ….
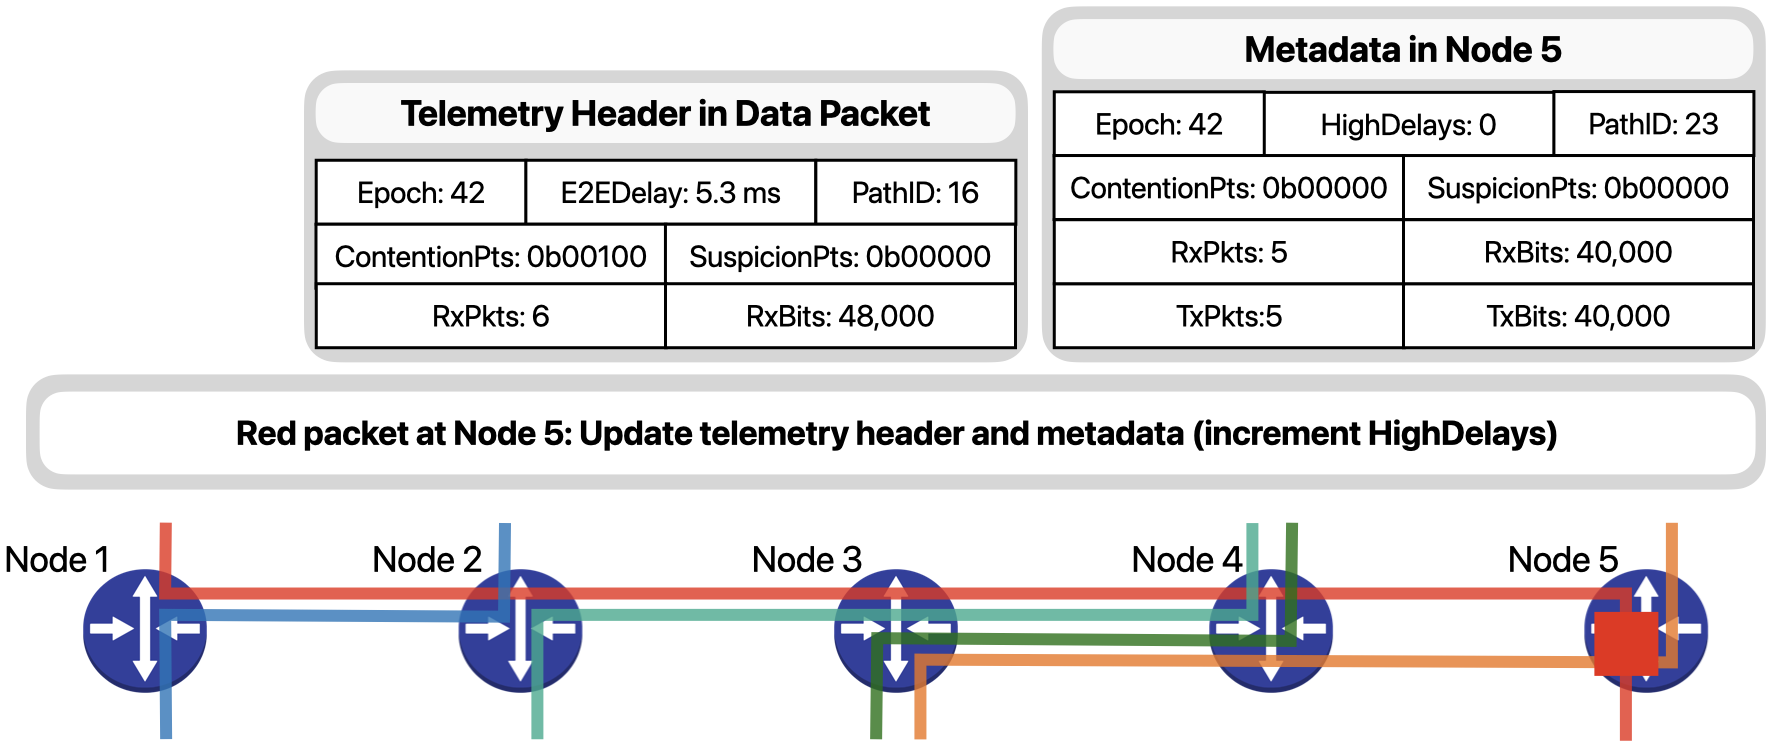
… it updates the metadata to consolidate the information contained in this packet with that collected by previous packets.
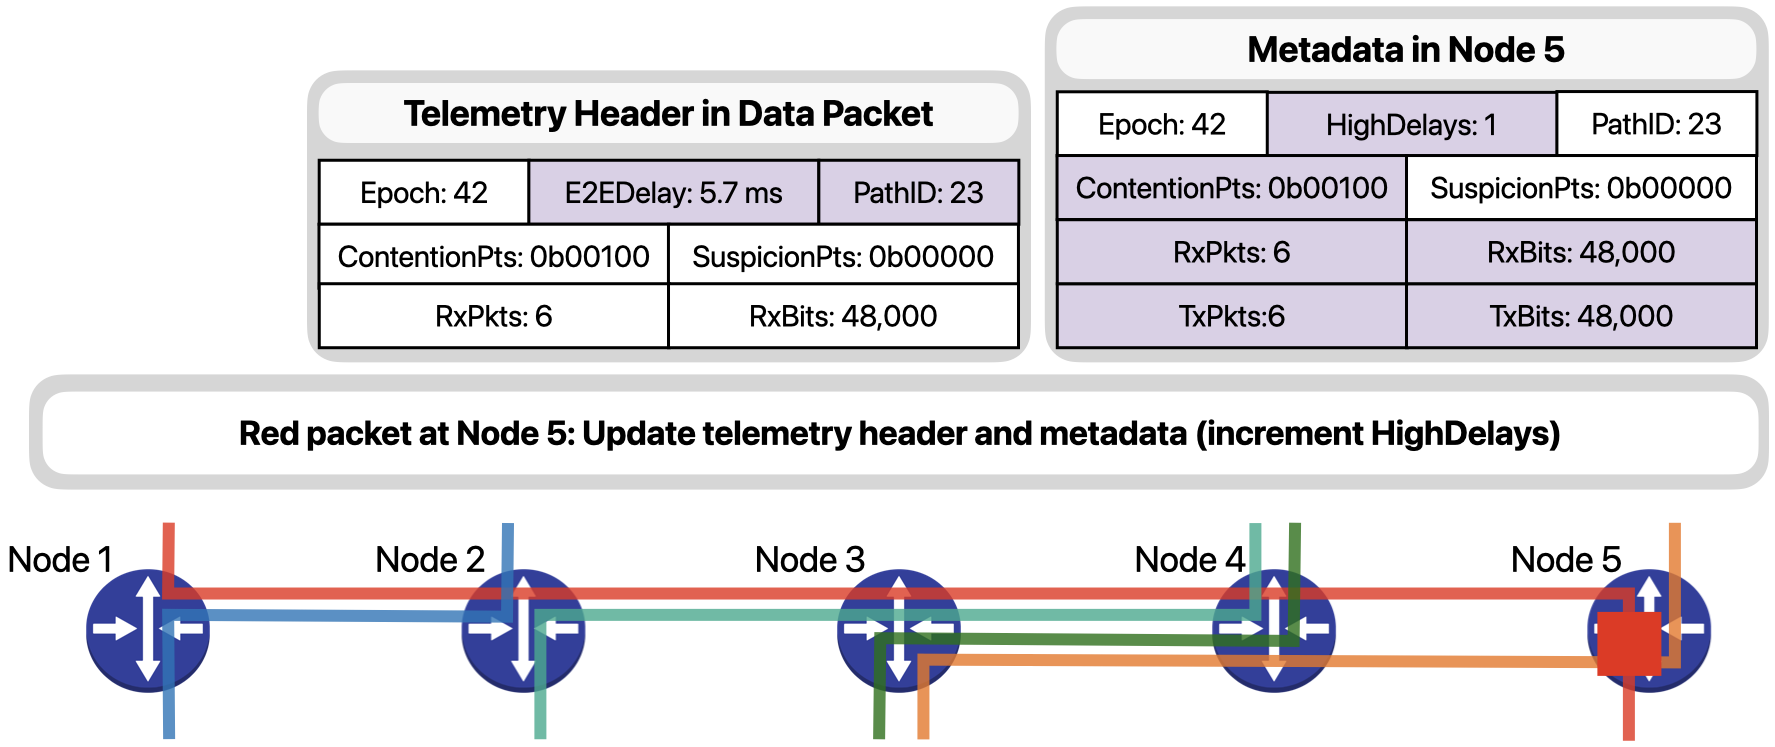
At the end of the 42nd epoch at Node 5, since the packet just shown as well as others experienced high delays, Node 5 generates a SLO violation report and sends it to the control plane. Control plane servers receive and analyze the generated reports to identify the culprit traffic disrupting network operation.
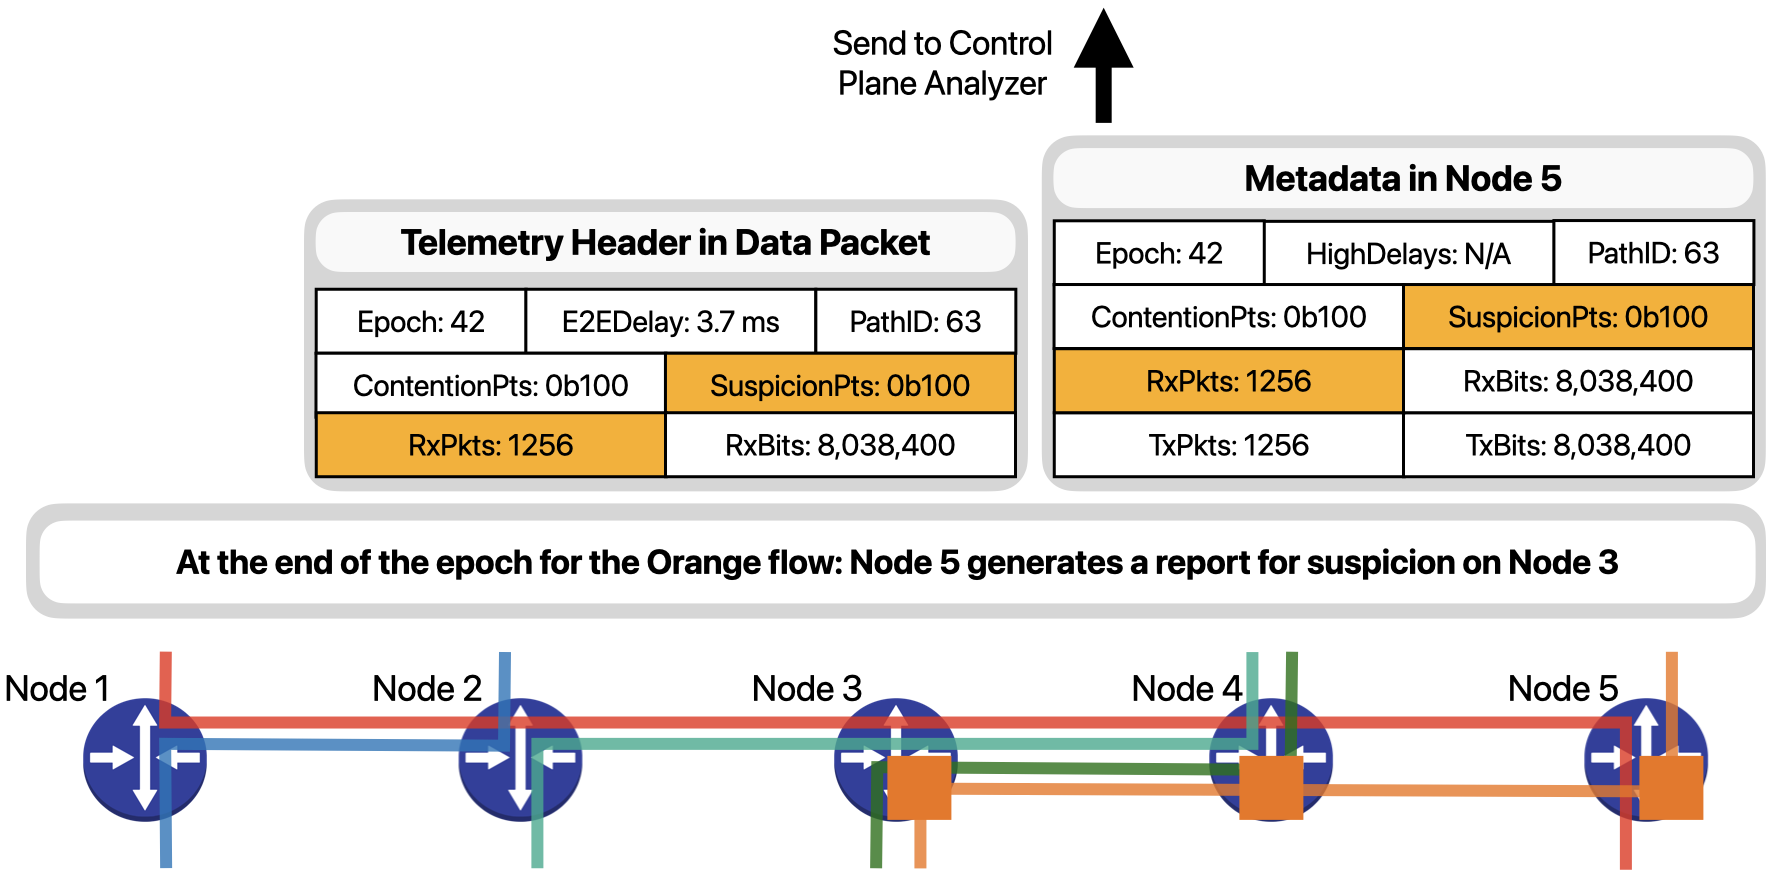
A similar procedure is carried out for the packets of orange flow, which are marked as suspicious by Node 3 because of a high packet rate. At the end of the 42nd epoch, Node 5 will also generate a report to indicate that the Orange flow had a suspicious behavior.
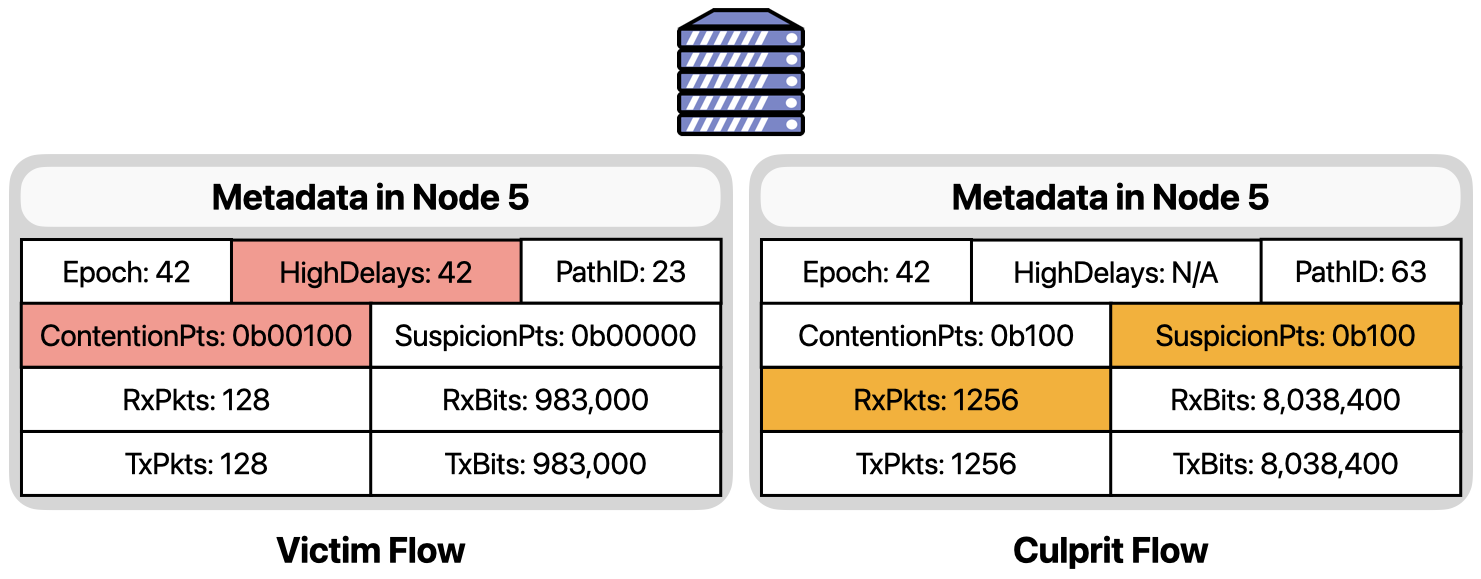
In the control plane, both reports are considered alongside to identify the orange flow as the culprit of the contention, and the red flow as the victim.
More details on how IntSight processes packets in the data plane to compute end-to-end delays, trace paths, identify contentions and suspicions, and detect violations can be found in the paper, which also details the coordination and diagnosis by control plane analyzer servers.
How well does it work?
One of the main concerns when monitoring a system is minimizing the overhead imposed on it. Let’s compare IntSight’s resource usage to state-of-the-art monitoring and debugging approaches considering their report rate, header space usage, and device memory usage.
To make things interesting, I consider six of the most representative networks from the REPETITA dataset. The smallest network, Bell Canada (BC), has forty eight nodes while the largest, Sprintlink (SL), has 3 hundred and 15 nodes. The number of links varies from a hundred and 30 to almost two thousand. The total demand is in the order of 1 to 20 million packets per second. The average path length varies from 4 to about 13 hops depending on device connectivity, while the number of flows to monitor varies from 1.2 to 50.6 million flows.
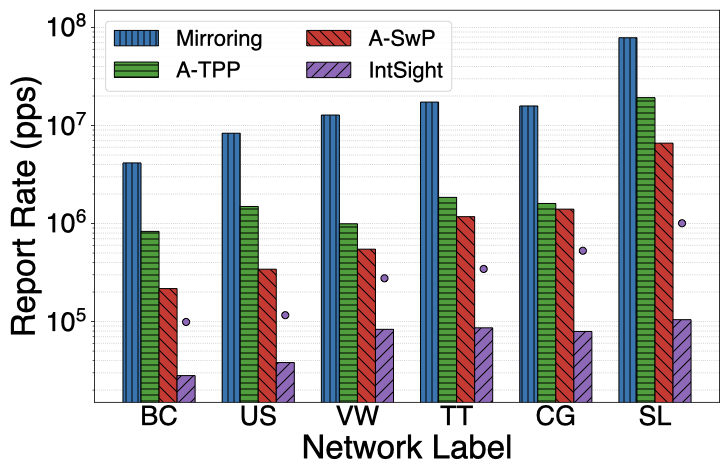
Next, I present the results obtained from the evaluation. In the graphs, the x-axis indicate a network topology, while the y-axis indicates the resource being evaluated. In the report rate graph, for IntSight, I show the average and maximum number of reports (as bars and circles, respectively) that would be generated for a violation lasting for an entire second on any single device in the network. These values are a function of the number of flows sharing each device.
IntSight was able to keep the reporting rate under one million packets per second in the worst case for all networks, with the average case always under a hundred thousand packets per second. Which is one to two orders of magnitude lower rate than the production traffic rate.
Header space usage was kept around 25 bytes, or only 2% of the regular MTU. Finally, IntSight required about a quarter of the memory available on existing programmable targets.
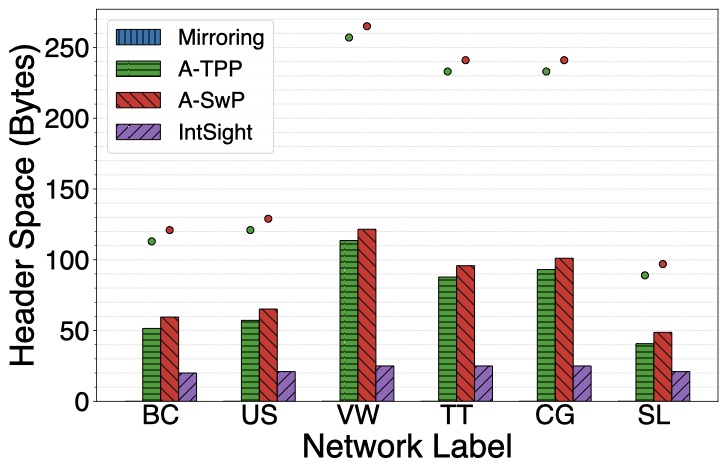
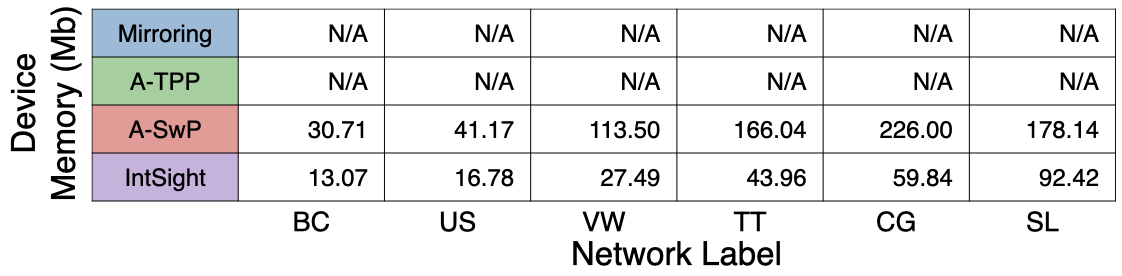
The difference in report rate between Mirroring approaches and Adapted TPP shows the benefits of using in-band network telemetry, this rate is reduced by up to one order of magnitude. Similarly, the difference in report rate between Adapted TPP and Adapted SwitchPointer shows the benefits of per-epoch reporting, which involves using part of the available device memory to store and consolidate telemetry information. Finally, the differences in utilization of all resources between Adapted SwitchPointer and IntSight show the benefits of in-network computation of path-wise telemetry information and conditional reporting of telemetry data. Compared to state-of-the-art approaches, IntSight achieves significantly lower report rate and header space usage with only modest requirements on device memory.
Conclusion
I have presented an in-network, distributed path-aware mechanism for monitoring network traffic capable of fine-grained and highly-accurate detection and diagnosis of problems impacting performance, with judicious utilization of control plane bandwidth and analyzer server resources. I have designed and implemented efficient data plane procedures for gradually computing path-wise metadata such as path IDs, contention points, and end-to-end delays. And have demonstrated the benefits of path-wise in-band network telemetry compared to state-of-the-art approaches, considering six representative network topologies and existing programmable data plane platforms.
You can learn more about IntSight by reading the full paper or contacting me. Or check out other blog posts.